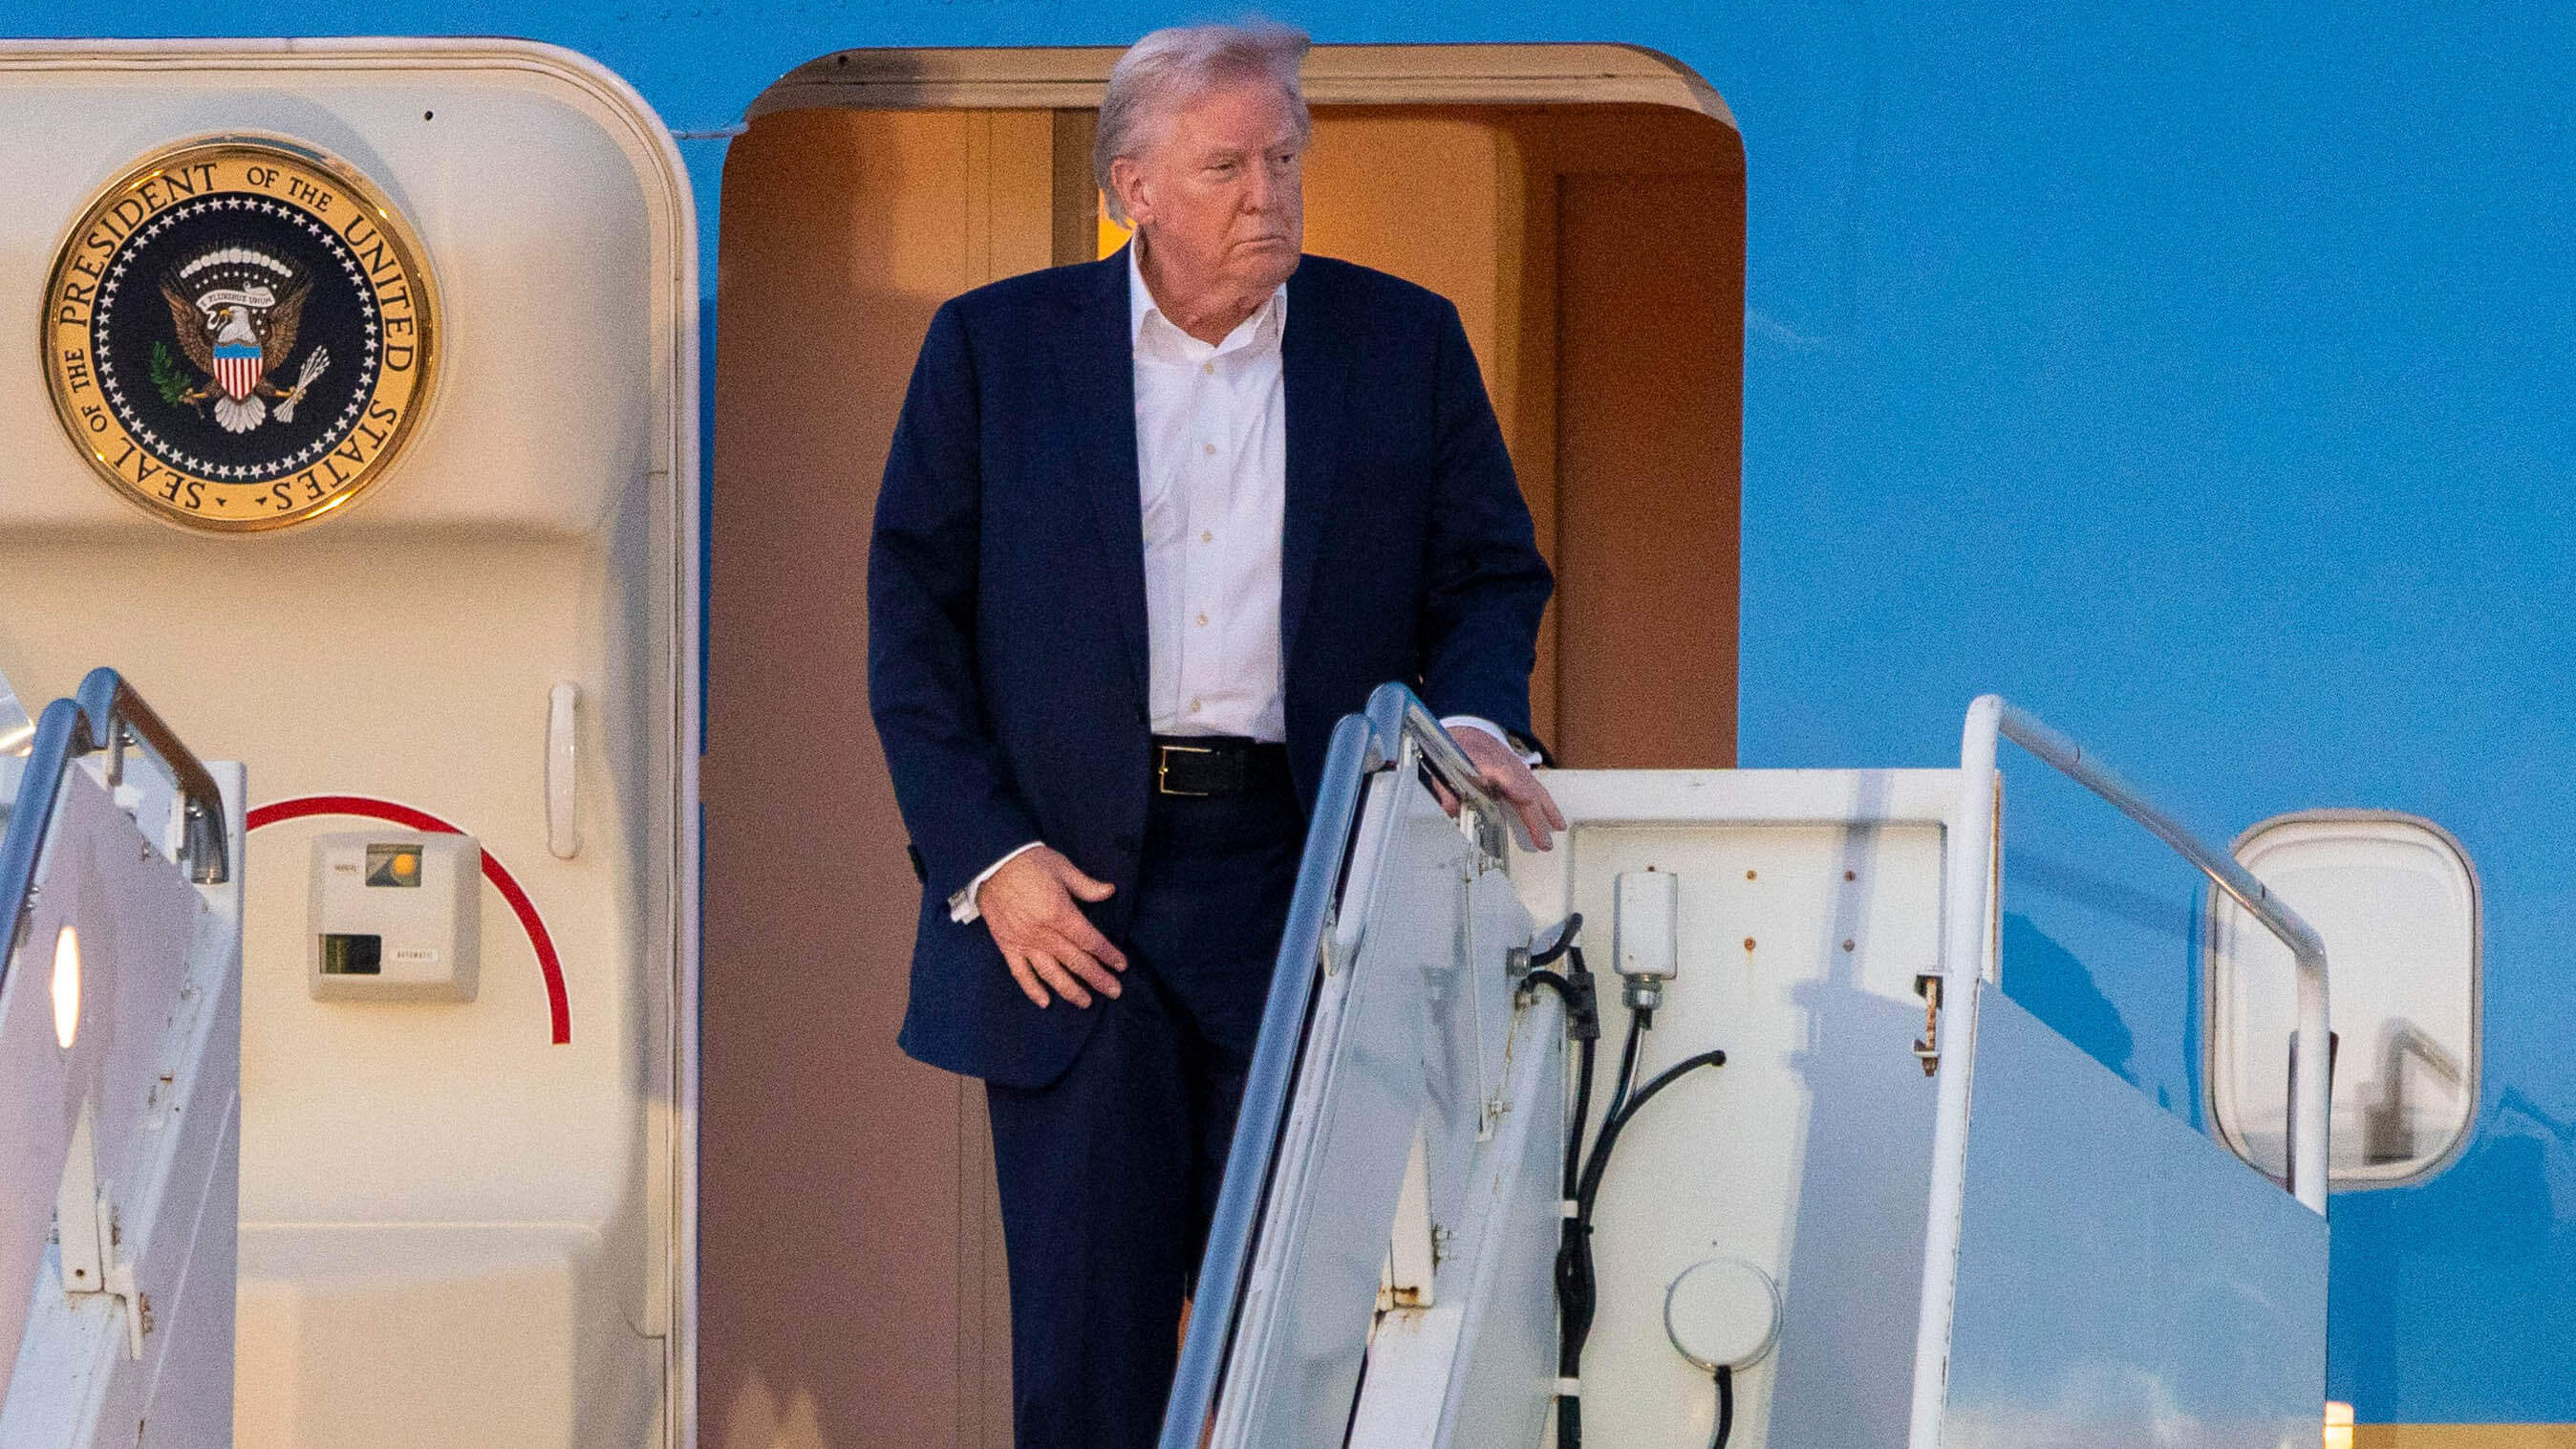
We now have a near-complete snapshot of Donald Trump’s second term economic performance over the first 100 days – and it paints a sharply different picture from both his first term and Joe Biden’s opening months.
From market reactions to job creation to executive orders, the early data offers a clear look at how Trump 2.0 is being received – and where it diverges.
Key Takeaways
-
Stock markets plunged under Trump 2.0, while both Trump 1.0 and Biden oversaw gains.
-
Biden added the most jobs, thanks largely to pandemic recovery momentum.
-
Inflation remained lowest under Trump 2.0, despite new economic headwinds.
-
Trump 2.0 shattered the record for executive orders signed in a first 100 days.
-
Border security numbers shifted dramatically depending on the administration.
Market Performance: Rough Start for Trump 2.0
The market response to Trump’s second term couldn’t look more different than the first time around.
-
In Trump 1.0 (2017), the S&P 500 rose about 5%, and the Dow climbed between 4–5%.
-
Biden saw even stronger gains in 2021: the S&P 500 went up by 10%, while the Dow was up 11%.
-
Under Trump 2.0 (2025), The S&P 500 was down 13.98% through 91 days – with a projected 15.37% drop over the full 100 days. The Dow has fallen 8.48% (estimated 9.32%) and the Nasdaq is down 15.94% (estimated 17.52%).
Early selloffs appear driven largely by policy uncertainty, particularly around tariff plans, suggesting markets are far more skeptical of Trump’s economic agenda this time around.
Job Creation: Biden Leads, Trump 2.0 Holds Ground
Biden posted the highest job gains during his first 100 days, driven largely by a COVID recovery bounce:
-
Biden: 1.38 million jobs added.
-
Trump 1.0: 522,000 jobs added.
-
Trump 2.0: 456,000 through March, with an estimated 608,000 by the end of April.
It’s important to note Biden’s figure was heavily pandemic-influenced. In Trump 2.0’s case, the labor market appears relatively stable but lacks the explosive growth seen in earlier rebounds.
Inflation and Wage Growth: Steady Hands
Inflation is a clear dividing line between the administrations:
-
Biden saw a 2.1% inflation rate over his first 100 days.
-
Trump 1.0: 0.7%.
-
Trump 2.0: a near-flat 0.1% up to March, with an April estimate bringing it to 0.133%.
Wage growth remained fairly stable across all three periods, hovering around 0.7% each time. Early indicators suggest Trump 2.0’s inflation management – at least so far — is outperforming his predecessor.

Executive Orders: Trump 2.0 by a Landslide
Executive orders have exploded under Trump’s return to office:
-
Trump 1.0: 24 executive orders in the first 100 days.
-
Biden: 42 executive orders.
-
Trump 2.0: an eye-popping 129 orders by late April.
While this aggressive pace signals a rapid policy rollout, several of Trump’s actions already face legal challenges that could blunt their long-term impact.
Border Security: Numbers Fall Under Trump 2.0
The southern border tells its own story.
-
Under Trump 1.0, border encounters averaged 24,593 per month during the first 100 days.
-
Under Biden, that monthly average ballooned to 132,896 – nearly five times higher.
-
Under Trump 2.0, encounters have dropped sharply again, averaging around 22,984 according to early estimates.
This suggests a quick return to stricter enforcement policies, though long-term effects will require further monitoring.
Trump 2.0: A Bold Start, But an Unsettled One
At the 100-day mark, Trump 2.0 looks like a mixed bag: aggressive executive action, stable inflation, and tighter border control — but serious turbulence in the financial markets and softer job creation compared to recent history.
Whether the markets stabilize or the economic uncertainty snowballs will tell the real story of Trump’s second term. Right now, the numbers reflect a presidency moving fast, but one that hasn’t yet convinced investors it’s charting a safer course.
Sources
U.S. Customs and Border Protection | U.S. Inflation Calculator | U.S. Bureau of Labor Statistics


