MLB
03/31/2026
11:40 ET
Get free expert and computer MLB picks for every game on March 31, 2026. With over 25 years of betting experience, our analysts and predictive models help you find the best value.

Conditions are ideal for power, with 17 mph winds blowing out to left-center and temperatures around 80 degrees — a strong setup for home runs. Jake Burger gets a premium matchup against Zach Eflin, who is coming off back surgery and posted the second-worst HR/9 among starters with 60+ innings last season. Burger, hitting out of the cleanup spot, is 3-for-7 with a home run against Eflin in his career. THE BAT projects a fair price around +375, making current numbers appealing. There are multiple ways to attack this game, especially with Texas yet to name a starter. Samuel Basallo at +550 or better also projects as +EV for the Baltimore Orioles. Betting on the earliest game of the slate is also an easy decision.

The Phillies are sending talented prospect Andrew Painter to the hill but we don't know what we'll get in his big league debut. After all, he had a 5.26 ERA in 26 minor league starts last year and the Nationals have some talented bats like James Wood and CJ Abrams at the top of their order. Meanwhile, the Nats are using relief pitcher P.J. Poulin as an opener and he had a 3.93 xERA in 24 2/3 innings last year. I don't trust him against a dangerous Phillies lineup led by Trea Turner, Kyle Schwarber, and Bryce Harper. Especially with a stiff 13 mpg breeze blowing towards the outfield at hitter-friendly Citizens Bank Park today.

The Chicago White Sox are listed at +134 on the moneyline, while I have them closer to -103 favorites, so this is a number I’m willing to back. Janson Junk gets the start for Miami, and his profile sets up well for Chicago. He’s a command-based pitcher with a low strikeout rate and limited swing-and-miss, which should allow the White Sox to consistently put the ball in play and generate offense. That’s especially important for their left-handed bats—Munetaka Murakami, Andrew Benintendi, and Colson Montgomery—who all project well in this matchup. Junk also isn’t a pitcher who typically works deep into games, so there’s a clear path for Chicago to elevate his pitch count and force Miami into the bullpen early. If that happens, the advantage swings even further, as the White Sox should be able to apply sustained pressure against the Marlins’ middle relief.

He may be 41 years old, but Max Scherzer looked like he was in his prime in spring training. In three starts he posted a 0.66 WHIP with as many strikeouts (nine) as hits and walks combined.
His first start sees him taking on a Rockies squad that is fanning like they’re serving a pharoah during his leisure period. They rank second in MLB with a 37.2% chase rate and third with a whiff rate of 34.9%. That’s led to them averaging more than a strikeout per inning at the plate.
Cody Ponce’s knee injury yesterday led to five relievers pitching nearly seven innings yesterday, so Scherzer is likely going to be allowed a bit more rope today. He should get six innings against an offense posting a .215 xBA so far this season.
It’s Tuesday—you have to have a home run bet in the account—and I’m hitting the button on Matt Olson. I price Olson closer to +250 to go deep in this matchup, and he has plenty of factors working in his favor. Olson is facing Aaron Civale of the Athletics, a low-velocity, sinker-heavy pitcher—and that’s a pitch Olson absolutely crushes from right-handers. Civale is also a fly-ball pitcher, which becomes a problem with the weather conditions at Truist Park on Tuesday: 83 degrees with the wind blowing out at 9 mph. Give me Olson to hit a home run. This bet checks every box—including the revenge narrative—and it’s worth noting he’s already taken Civale deep once in just three career at-bats.
I don’t usually put a lot of weight into batter vs. pitcher data given the small samples, but it’s hard to ignore that Brent Rooker has taken José Suárez deep three times in just five at-bats — especially with Rooker sitting at +475. Rooker had a strong spring and may be off to a slow start, but the power is real. He has legitimate 40-HR upside, which puts him in a rare tier of hitters. Suárez is more of a bullpen arm being stretched into a starting role due to the injury to Spencer Strider, which adds risk. The environment isn’t elite, but 80-degree weather in Atlanta with a total of 9 is still solid. Fair value on this HR prop is closer to +400, and Rooker projects similarly to names like Ronald Acuña Jr., Shea Langeliers, and Austin Riley — all of whom are priced shorter.

Mike Trout doesn't need much of an invitation, and Taillon is practically rolling out the red carpet.
Ten home runs and nine walks in just 13.1 spring training innings tell you that this is a pitcher who can't find the zone and is getting destroyed when he does.
Trout has already taken Taillon deep in their career matchup. The Angeles slugger launched two bombs on Opening Day at Houston, and I’ll back him to do it again Tuesday night at Wrigley.
José Soriano is riding a 29.2% strikeout rate and a jaw-dropping 41.3% whiff rate through his 2026 opener. This follows a strong spring where the Los Angeles Angels righty struck out 13 across 11 ⅔ and eight per nine frames in 2025.
Cold, heavy air at Wrigley Field plays right into Soriano's hard sinker and devastating slider combo. Back him to punch out at least five on Tuesday night.


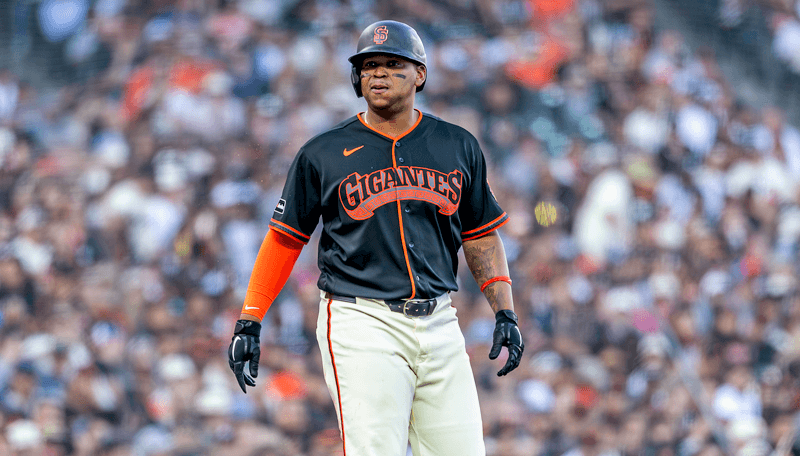
Matt Chapman has made a lot of powerful contact out of the gate. He is responsible for the three hardest hit balls the Giants have this season, indicating the production is not far off.
Chapman has enjoyed a lot of success against German Marquez in his career. He is 6-15 with four hits going for extra bases, three of which left the park.
Giants ace Logan Webb was roughed up in his season debut. That said, he's a proven vet with a 2.94 FIP in 132 starts over the last four years so expect him to bounce back. Meanwhile, German Marquez makes his Padres debut and he'll be excited to play at pitcher-friendly Petco Park after spending his entire career at Coors Field. He gets a favorable matchup against the the Giants who are last in the majors in OPS (.441) while sitting in the bottom 3 in barrel rate and hard hit rate. The Friars haven't been much better, ranking 28th in OPS (.512) and 26th in barrel rate.

Greene is hitting just .176 this season, but he finally found a bit of an offensive rhythm on Monday, finishing 2-for-5 with a pair of singles. Sometimes, all a hitter needs is some confidence to get them going, and Greene has homered against Pfaadt before, who gave up 26 bombs last season. Greene clubbed 36 bombs last year as well.
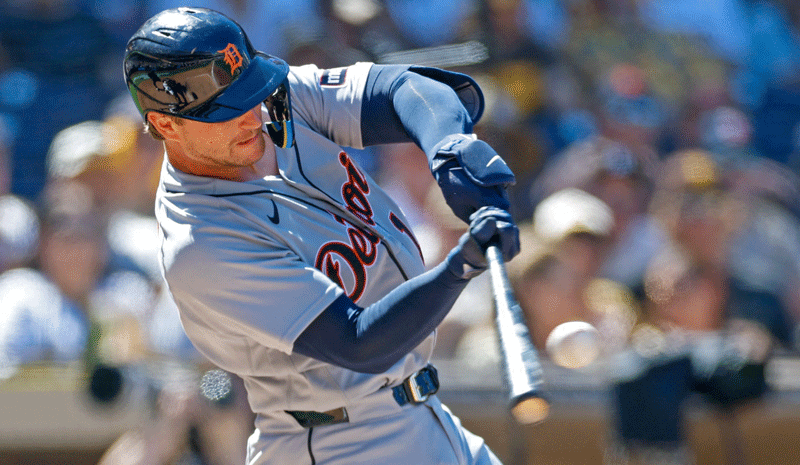
Dingler is off to a red-hot start in this young 2026 campaign, batting .333 with five RBIs already. The catcher drove in a run in Monday’s loss, and he’s recorded at least one RBI in three of Detroit’s four games so far. He has an RBI against Pfaadt in two at-bats.

Bibee’s primary flaw is the home run ball. He allowed 1.33 HR/9 a year ago despite a 10-point uptick in groundball rate.
Max Muncy posted 16 of his 19 home runs off right-handed pitchers a season ago, tagging them for a 157 wRC+ with substantial power (.247 ISO). He hits Bibee’s three-pitch mix against lefties (primarily four-seamers and change-ups with a dash of cutters) well, with decreased whiff rates and increased effectiveness against all three offerings.
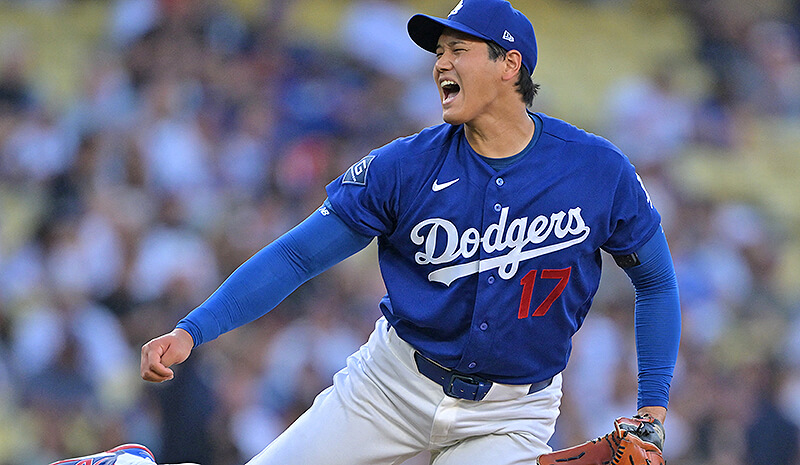
Shohei Ohtani’s arsenal of pitches is downright filthy (115 Stuff+), and he was dominant at home a season ago (.151 BAA, 1.71 ERA).
There’s a fully stocked bullpen behind him after Sunday’s off day and yesterday’s three-pitcher outing, so they should limit a Cleveland Guardians lineup with poor numbers (.279 wOBA, 79 wRC+).
Tanner Bibee (104 Stuff+) has been a dependable arm, recording an xERA below 3.75 in each of the last three seasons (87 starts). The weather favors these two strong starting pitchers, as there’ll be rain in Southern California.
Covers’ has more than 25 years of experience making smart MLB picks from the season’s first pitch to the World Series.
We find the best MLB odds and share our picks and baseball best bets for all the significant games of the baseball season right here on this page.
Our picks are researched and analyzed by experienced sports bettors looking for an edge to get the best value from their MLB betting.
Making smart MLB picks means looking beyond the favorites. Our free expert baseball picks will include a wide variety of bet types and markets.
Every day our baseball analysts look for quality baseball picks to share. You can expect well-researched picks on the money, run line, totals, player props, and much more.
Run lines are what other sports like football and basketball refer to as point spreads. Run lines even the odds between two teams, offering bettors as close to an even matchup as possible. Our analysts research vital stats, pitching matchups, injuries, and more to give you the best possible edge before making your MLB run line bets.
Covers’ analysts make MLB Over/Under picks throughout the baseball season. Betting on MLB Over/Unders means choosing whether you think the combined total runs scored in a game will be Over or Under a specific run total set by oddsmakers.
Betting on the MLB moneyline means picking which team will win a game outright. While less common than picking the run line or even a prop, our analysts will always look for high-value baseball moneyline picks if they feel it’s the best bet.
There’s always value in MLB props. Our team scours through game, team, and player props to try and find opportunity and value. From strikeouts to home runs, expect well-researched MLB prop picks from Covers.
Covers’ consensus MLB picks show you the odds and predictions that our vibrant community of bettors and players are making. Try our picks on with our free MLB contests for a chance at prizes and more.
If you’re ready to bet on MLB picks, you first need to find the right sportsbook. The best MLB betting sites offer secure banking, best odds, bonuses, and reliable customer service.
Covers’ staff of sports betting fans also offers a wide array of free picks for the NFL, NBA, NHL, NCAA basketball, and NCAA football.
Covers’ MLB picks release on game day. Some significant matchups like playoff games release in the days leading up to the game.
Covers provides free MLB picks covering many markets, including run lines, totals, moneylines, player props, and more.
 Established in 1995,