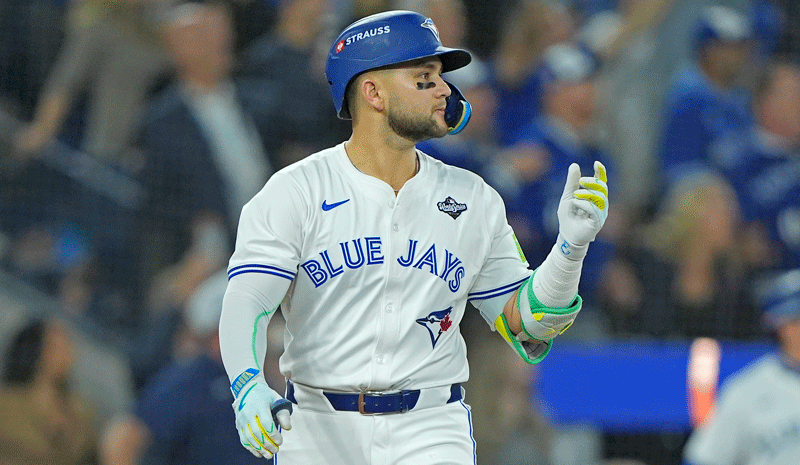
New York @ Toronto Picks & Props
NYM vs TOR Picks
MLB PicksCheck out all baseball picks and predictions
Latest headlines Checkout latest headlinesRead more
NYM vs TOR Consensus Picks
 64% picking NY Mets
Total PicksNYM 400, TOR 228
NYM vs TOR Props
Joey Loperfido Total Hits Props • Toronto
The leading projection system (THE BAT X) projects Joey Loperfido in the 90th percentile when estimating his BABIP ability. The wind projects to be blowing out to CF at 8.1-mph in this game, the 2nd-most-favorable of the day for bats. Joey Loperfido hits a lot of his flyballs to center field (39.1% — 93rd percentile) and is fortunate to face baseball's 10th-shallowest CF fences in today's game. The New York Mets outfield defense projects as the 2nd-weakest out of all the teams on the slate today. Joey Loperfido will possess the home field advantage in today's game, which figures to bolster all of his stats.
Spencer Horwitz Total Hits Props • Toronto
The leading projection system (THE BAT X) projects Spencer Horwitz in the 84th percentile when estimating his batting average skill. Rogers Centre has the 8th-shallowest centerfield dimensions in the league. The wind projects to be blowing out to CF at 8.1-mph in this game, the 2nd-most-favorable of the day for bats. The New York Mets outfield defense projects as the 2nd-weakest out of all the teams on the slate today. Home field advantage typically improves hitter stats across the board, and Spencer Horwitz will hold that advantage in today's matchup.
Daulton Varsho Total Hits Props • Toronto
Daulton Varsho is projected to bat 2nd in the batting order in today's game. Rogers Centre has the 8th-shallowest centerfield dimensions in the league. The wind projects to be blowing out to CF at 8.1-mph in this game, the 2nd-most-favorable of the day for bats. Hitters such as Daulton Varsho with extreme flyball tendencies are usually more effective when facing pitchers like David Peterson who skew towards the groundball end of the spectrum. The New York Mets outfield defense projects as the 2nd-weakest out of all the teams on the slate today.
Vladimir Guerrero Jr. Total Hits Props • Toronto
The leading projection system (THE BAT X) projects Vladimir Guerrero Jr. as the 2nd-best hitter in the game as it relates to his batting average ability. Vladimir Guerrero Jr. is projected to hit 3rd on the lineup card today. The wind projects to be blowing out to CF at 8.1-mph in this game, the 2nd-most-favorable of the day for bats. Vladimir Guerrero Jr. will have the benefit of the platoon advantage against David Peterson today. Vladimir Guerrero Jr. hits a high percentage of his flyballs to center field (38.4% — 85th percentile) and is fortunate to face the league's 10th-shallowest CF fences in today's matchup.
Jesse Winker Total Hits Props • NY Mets
The leading projection system (THE BAT X) projects Jesse Winker in the 84th percentile when assessing his overall offensive skill. Jesse Winker is penciled in 2nd on the lineup card in this matchup. Rogers Centre has the 8th-shallowest centerfield dimensions in the league. The wind projects to be blowing out to CF at 8.1-mph in this game, the 2nd-most-favorable of the day for bats. Hitting from the opposite that Luke Bard throws from, Jesse Winker will have an advantage in today's game.
Mark Vientos Total Hits Props • NY Mets
When estimating his overall offensive ability, Mark Vientos ranks in the 79th percentile according to the leading projections (THE BAT X). Mark Vientos is penciled in 3rd in the lineup today. The wind projects to be blowing out to CF at 8.1-mph in this game, the 2nd-most-favorable of the day for bats. Mark Vientos hits a lot of his flyballs to center field (39.8% — 98th percentile) and is a great match for the park considering he'll be hitting towards baseball's 10th-shallowest CF fences today. Over the past week, Mark Vientos's Barrel% has experienced a surge, jumping from his seasonal rate of 15.5% up to 23.1%.
Starling Marte Total Hits Props • NY Mets
The leading projection system (THE BAT X) projects Starling Marte in the 97th percentile as it relates to his BABIP talent. Rogers Centre has the 8th-shallowest centerfield dimensions in the league. The wind projects to be blowing out to CF at 8.1-mph in this game, the 2nd-most-favorable of the day for bats. Starling Marte's ability to hit the ball at a base hit-optimizing launch angle (between -4° and 26°) has increased from last year to this one, going from 42.4% to 50.5%. As it relates to his wOBA and overall offense, Starling Marte has had bad variance on his side this year. His .311 rate falls considerably below the leading projection system (THE BAT X)'s version of Statcast-based Expected wOBA (xwOBA) at .342.
Pete Alonso Total Hits Props • NY Mets
The leading projection system (THE BAT X) projects Pete Alonso in the 96th percentile when assessing his overall offensive talent. Pete Alonso is projected to bat 4th on the lineup card in this matchup. Rogers Centre has the 8th-shallowest centerfield dimensions in the league. The wind projects to be blowing out to CF at 8.1-mph in this game, the 2nd-most-favorable of the day for bats. Pete Alonso has made notable improvements with his Barrel% lately, upping his 12.5% seasonal rate to 19.2% in the last two weeks' worth of games.
George Springer Total Hits Props • Toronto
The leading projection system (THE BAT X) projects George Springer in the 91st percentile when assessing his overall offensive ability. George Springer is projected to bat 1st on the lineup card today. Rogers Centre has the 8th-shallowest centerfield dimensions in the league. The wind projects to be blowing out to CF at 8.1-mph in this game, the 2nd-most-favorable of the day for bats. Hitting from the opposite that David Peterson throws from, George Springer will have the upper hand today.
Davis Schneider Total Hits Props • Toronto
When estimating his overall offensive skill, Davis Schneider ranks in the 76th percentile according to the leading projections (THE BAT X). Rogers Centre has the 8th-shallowest centerfield dimensions in the league. The wind projects to be blowing out to CF at 8.1-mph in this game, the 2nd-most-favorable of the day for bats. Batting from the opposite that David Peterson throws from, Davis Schneider will have an advantage in today's matchup. Extreme groundball batters like Davis Schneider usually hit better against extreme flyball pitchers like David Peterson.
Brandon Nimmo Total Hits Props • NY Mets
As it relates to his overall offensive skill, Brandon Nimmo ranks in the 94th percentile according to the leading projections (THE BAT X). Brandon Nimmo is penciled in 5th on the lineup card in this matchup. Rogers Centre has the 8th-shallowest centerfield dimensions in the league. The wind projects to be blowing out to CF at 8.1-mph in this game, the 2nd-most-favorable of the day for bats. Brandon Nimmo will have the handedness advantage against Luke Bard in today's game.
Ernie Clement Total Hits Props • Toronto
Ernie Clement's batting average skill is projected to be in the 91st percentile according to the leading projection system (THE BAT X). Ernie Clement is projected to bat 5th in the batting order in today's game, which would be an upgrade from his 81% rate of hitting in the bottom-half of the lineup this season. Rogers Centre has the 8th-shallowest centerfield dimensions in the league. The wind projects to be blowing out to CF at 8.1-mph in this game, the 2nd-most-favorable of the day for bats. Ernie Clement will have the handedness advantage over David Peterson in today's game.
Francisco Lindor Total Hits Props • NY Mets
The leading projection system (THE BAT X) projects Francisco Lindor in the 96th percentile when estimating his overall offensive talent. Francisco Lindor is projected to bat 1st on the lineup card in today's game. Rogers Centre has the 8th-shallowest centerfield dimensions in the league. The wind projects to be blowing out to CF at 8.1-mph in this game, the 2nd-most-favorable of the day for bats. Francisco Lindor has made big improvements with his Barrel% in recent games, bettering his 13.8% seasonal rate to 20.6% in the past 14 days.
J.D. Martinez Total Hits Props • NY Mets
When estimating his overall offensive ability, J.D. Martinez ranks in the 87th percentile according to the leading projections (THE BAT X). Rogers Centre has the 8th-shallowest centerfield dimensions in the league. The wind projects to be blowing out to CF at 8.1-mph in this game, the 2nd-most-favorable of the day for bats. Compared to his seasonal average of 14.4°, J.D. Martinez has significantly improved his launch angle recently, posting a 21° angle in the past 14 days. J.D. Martinez has put up a .340 wOBA (the best measure of overall offense) this year, placing in the 81st percentile.
Jose Iglesias Total Hits Props • NY Mets
The leading projection system (THE BAT X) projects Jose Iglesias in the 90th percentile as it relates to his batting average ability. Rogers Centre has the 8th-shallowest centerfield dimensions in the league. The wind projects to be blowing out to CF at 8.1-mph in this game, the 2nd-most-favorable of the day for bats. Jose Iglesias has seen a notable gain in his exit velocity on flyballs lately; just compare his 86.6-mph average over the last week to his seasonal EV of 83.8-mph. Jose Iglesias's ability to hit the ball at a HR-optimizing launch angle (between 23° and 34°) has gotten better of late, going from 11.7% on the season to 30% over the last 7 days.
Alejandro Kirk Total Hits Props • Toronto
The leading projection system (THE BAT X) projects Alejandro Kirk in the 86th percentile when it comes to his batting average talent. Alejandro Kirk has primarily hit in the back-half of the batting order this season (71% of the time), but he is projected to hit 4th on the lineup card today. Rogers Centre has the 8th-shallowest centerfield dimensions in the league. The wind projects to be blowing out to CF at 8.1-mph in this game, the 2nd-most-favorable of the day for bats. Batting from the opposite that David Peterson throws from, Alejandro Kirk will have an edge in today's matchup.
Francisco Alvarez Total Hits Props • NY Mets
Rogers Centre has the 8th-shallowest centerfield dimensions in the league. The wind projects to be blowing out to CF at 8.1-mph in this game, the 2nd-most-favorable of the day for bats. Francisco Alvarez has seen a substantial increase in his exit velocity recently; just compare his 98.1-mph average in the last 7 days to his seasonal 88.1-mph mark.
DJ Stewart Total Hits Props • NY Mets
Rogers Centre has the 8th-shallowest centerfield dimensions in the league. The wind projects to be blowing out to CF at 8.1-mph in this game, the 2nd-most-favorable of the day for bats. D.J. Stewart will receive the benefit of the platoon advantage against Luke Bard today. D.J. Stewart has gotten much quicker this season, improving from last year's 26.35 ft/sec to 26.97 ft/sec now (according to Statcast's Sprint Speed metric). Based on Statcast metrics, the leading projection system (THE BAT X)'s version of Expected wOBA (.328) provides evidence that D.J. Stewart has had some very poor luck this year with his .290 actual wOBA.
Brian Serven Total Hits Props • Toronto
Rogers Centre has the 8th-shallowest centerfield dimensions in the league. The wind projects to be blowing out to CF at 8.1-mph in this game, the 2nd-most-favorable of the day for bats. Batting from the opposite that David Peterson throws from, Brian Serven will have the upper hand in today's game. The New York Mets outfield defense projects as the weakest out of all the teams on the slate today. Brian Serven will hold the home field advantage today, which figures to boost all of his stats.
NYM vs TOR Trends
 New York Trends
The New York Mets have hit the Moneyline in 55 of their last 85 games (+18.25 Units / 16% ROI)
The New York Mets have hit the 1st Five Innings (F5) Moneyline in 52 of their last 96 games (+16.75 Units / 13% ROI)
The New York Mets have covered the Run Line in 49 of their last 86 games (+12.65 Units / 12% ROI)
The New York Mets have covered the 1st Five Innings (F5) Run Line in 52 of their last 88 games (+11.45 Units / 11% ROI)
The New York Mets have hit the Team Total Under in 22 of their last 32 away games (+10.30 Units / 28% ROI)
The New York Mets have only hit the 1st Five Innings (F5) Team Total Under in 41 of their last 90 games (-14.05 Units / -13% ROI)
The New York Mets have only hit the Game Total Over in 13 of their last 39 away games (-13.60 Units / -32% ROI)
 Toronto Trends
The Toronto Blue Jays have hit the Game Total Over in 32 of their last 47 games at home (+16.90 Units / 33% ROI)
The Toronto Blue Jays have covered the Run Line in 26 of their last 42 games (+9.45 Units / 17% ROI)
The Toronto Blue Jays have hit the 1st Five Innings (F5) Team Total Under in 16 of their last 24 games (+7.00 Units / 23% ROI)
The Toronto Blue Jays have hit the Team Total Over in 6 of their last 9 games at home (+2.45 Units / 23% ROI)
The Toronto Blue Jays have hit the 1st Five Innings (F5) Moneyline in 9 of their last 18 games at home (+2.10 Units / 8% ROI)
The Toronto Blue Jays have only hit the Game Total Under in 16 of their last 51 games at home (-21.65 Units / -38% ROI)
The Toronto Blue Jays have only covered the 1st Five Innings (F5) Run Line in 58 of their last 122 games (-16.30 Units / -11% ROI)
The Toronto Blue Jays have only hit the Moneyline in 28 of their last 62 games at home (-12.70 Units / -16% ROI)
NYM vs TOR Top User Picks
NY Mets Team Leaders
| Rank | Leader | L10 | Units |
|---|---|---|---|
| 1 | jessestars | 5-4-1 | +19870 |
| 2 | F-Orrell | 4-5-1 | +17629 |
| 3 | tjansen70 | 7-2-1 | +17280 |
| 4 | FRANKYFUGAZI1 | 6-4-0 | +15550 |
| 5 | billdo | 3-5-2 | +15170 |
| 6 | BundiniBrown | 5-5-0 | +14785 |
| 7 | CigarSt22 | 4-6-0 | +14368 |
| 8 | salgundy | 5-4-1 | +14235 |
| 9 | dashow69 | 3-7-0 | +13880 |
| 10 | braustin1 | 5-5-0 | +13475 |
| All Mets Money Leaders | |||
Toronto Team Leaders
| Rank | Leader | L10 | Units |
|---|---|---|---|
| 1 | hackorama | 6-4-0 | +19495 |
| 2 | accxmass | 5-4-1 | +17505 |
| 3 | Midway28 | 5-4-1 | +15885 |
| 4 | CastlemontDB91 | 6-3-1 | +15740 |
| 5 | Rossi35 | 7-3-0 | +15250 |
| 6 | CitoGMoney | 3-6-1 | +14955 |
| 7 | Kowalabear1994 | 7-3-0 | +14035 |
| 8 | rapa76 | 7-3-0 | +13985 |
| 9 | captty55 | 4-6-0 | +12990 |
| 10 | sailorman1965 | 8-2-0 | +12945 |
| All Blue Jays Money Leaders | |||


